Week 1: Microplants Data Cleansing
Monday June 24, 2019
Today was the start of working on my project! Using the code from a fellow Field Museum employee, Victoria, that cleans some data to be usable, we will create a more thorough script that cleans data, converts measurements of pixels into microns, and pairs the raw data from kiosks with results of the age groups of the responders to make a connection between age and validity of data. (For example, if the measurements of the major and minor axes don’t cross, go off screen, or intersect too far from perpendicular, the data is unusable.)
The issue that we have to firstly solve is that the measurements from the Microplants kiosk is just that: measurements with a time stamp in UTC along with serial IDs. The surveys of what age group made the measurements is on a different CSV and it’s our task to match up the entries from the two sheets together. For clarity, I’ll call the former measurement data and the latter age data. This doesn’t sound too bad, but we found that the measurement data contains more entries than the age data; after looking at the first few entries in age data, we found corresponding entries in measurement data (by matching up the timestamps manually which was a whole other process) and our next step is to write a python script that will match up the rest of entries (about a thousand).
Briefly going back to the timestamp matching, the timestamp in the two sheets are presented in a format different from each other. For the current purposes, we manually edited them (using Excel’s beautiful functions) so our script will be able to easily compare them and see if there are matches. In the future, we would like to have the script do this for us so a user would only need to press one button and everything would be done for them.
Stay tuned for more updates!
-Al
Tuesday June 25, 2019
Today was spent adjusting the script from Victoria so that it would export a new sheet with the matches and with new columns that quantifies the data as useable or not and that specify the age demographic of that data reporter. This will allow us to see if there are any trends between certain age groups and the validity of the data they record.
A lot of the nitty gritty work was already implemented (such as syntax to create data frames using panda and reading CSV files), but we still ran into a few issues that may or may not be common; below I’ll go through them.
First, our script wasn’t recognizing the name of our first column when we imported the data frame as a CSV. When we printed out, the first row of the CSV, we would get some garbage characters in front of the first column (shown below)

We tried renaming the first column using various functions from the pandas package, but nothing work. After some research, we found the error was most likely caused by an encoding issue. The CSV we were reading in was encoded as UTF-8, but we had to make that clear to the compiler (because as we all learned in any intro CS class, computers are stupid and will only do exactly what you tell it to :D ). In order to clarify to the compiler that the CSV’s are UTF-8, we added a little segment to the line that opens the file.
measurements_data = open(r'[path].csv', encoding='utf-8')
Our second main error dealt with the formatting of our age data in Excel. CSV’s can be conveniently opened in Excel and edited, but in order to match our age data to entries of the measurement data, we wanted to timestamp to be of a certain format. However, Excel has a mind of its own and would rearrange our timestamps to the default when we would open the age data in Notepad then again in Excel. Lesson? Don’t open in Excel! Or figure out a way to avoid the default date format first because this caused some issues that we didn’t realize.
Additionally, from Victoria’s code, we still had problems importing the python file that does the calculations, so for now, we copy pasted that code at the top of our current file and hardcoded the import of the age data. Once this is working, we want to make ALL of these variables so the user can simply upload the raw data for both the ages and measurements and the script will do the rest. Our current next steps will be exporting the data into a CSV and seeing how good (or unsuccessful) our script is!
Thanks for reading, see you next time!
-Al
Wednesday June 26, 2019
After I left yesterday, Jose continued working on our script and added a feature that exports our resultant data frame as a CSV file. From our first attempt, our output data can be found here. After a quick glance, we can see this output has over 200 lines of data and most of the entries are labeled as bad, which reasonably doesn’t sounds right. After looking into it more, I realized the root of this issue was due to Jose and I not understanding how the function cleaned the data, specifically this line down here:

In short, listed_vals contains lists of the segments drawn. Then the code above creates any and all combinations of two segments from each data entry in the measurement data (which very well could contain more than 2 segments since there could be multiple lobes in one picture for the user to measure) to then perform the calculations on. Thus, our current code appends every combination of 2 segments from each picture onto our exported CSV, causing the CSV to be hundreds of lines long. To fix it, we moved the if statements around to only append data if the combination of 2 segments intersected.
Additionally, we found that while the age data had completely unique timestamps, the measurement data sometimes had two entries with the same timestamp (down to the minute). Although they varied by the second, since the age data’s timestamps only included up to the nearest minute, we had to truncate the timestamps in measurement data. Thus sometimes we had one entry in age data potentially correspond with multiple entries in measurement data (based on the time stamps) as seen below:
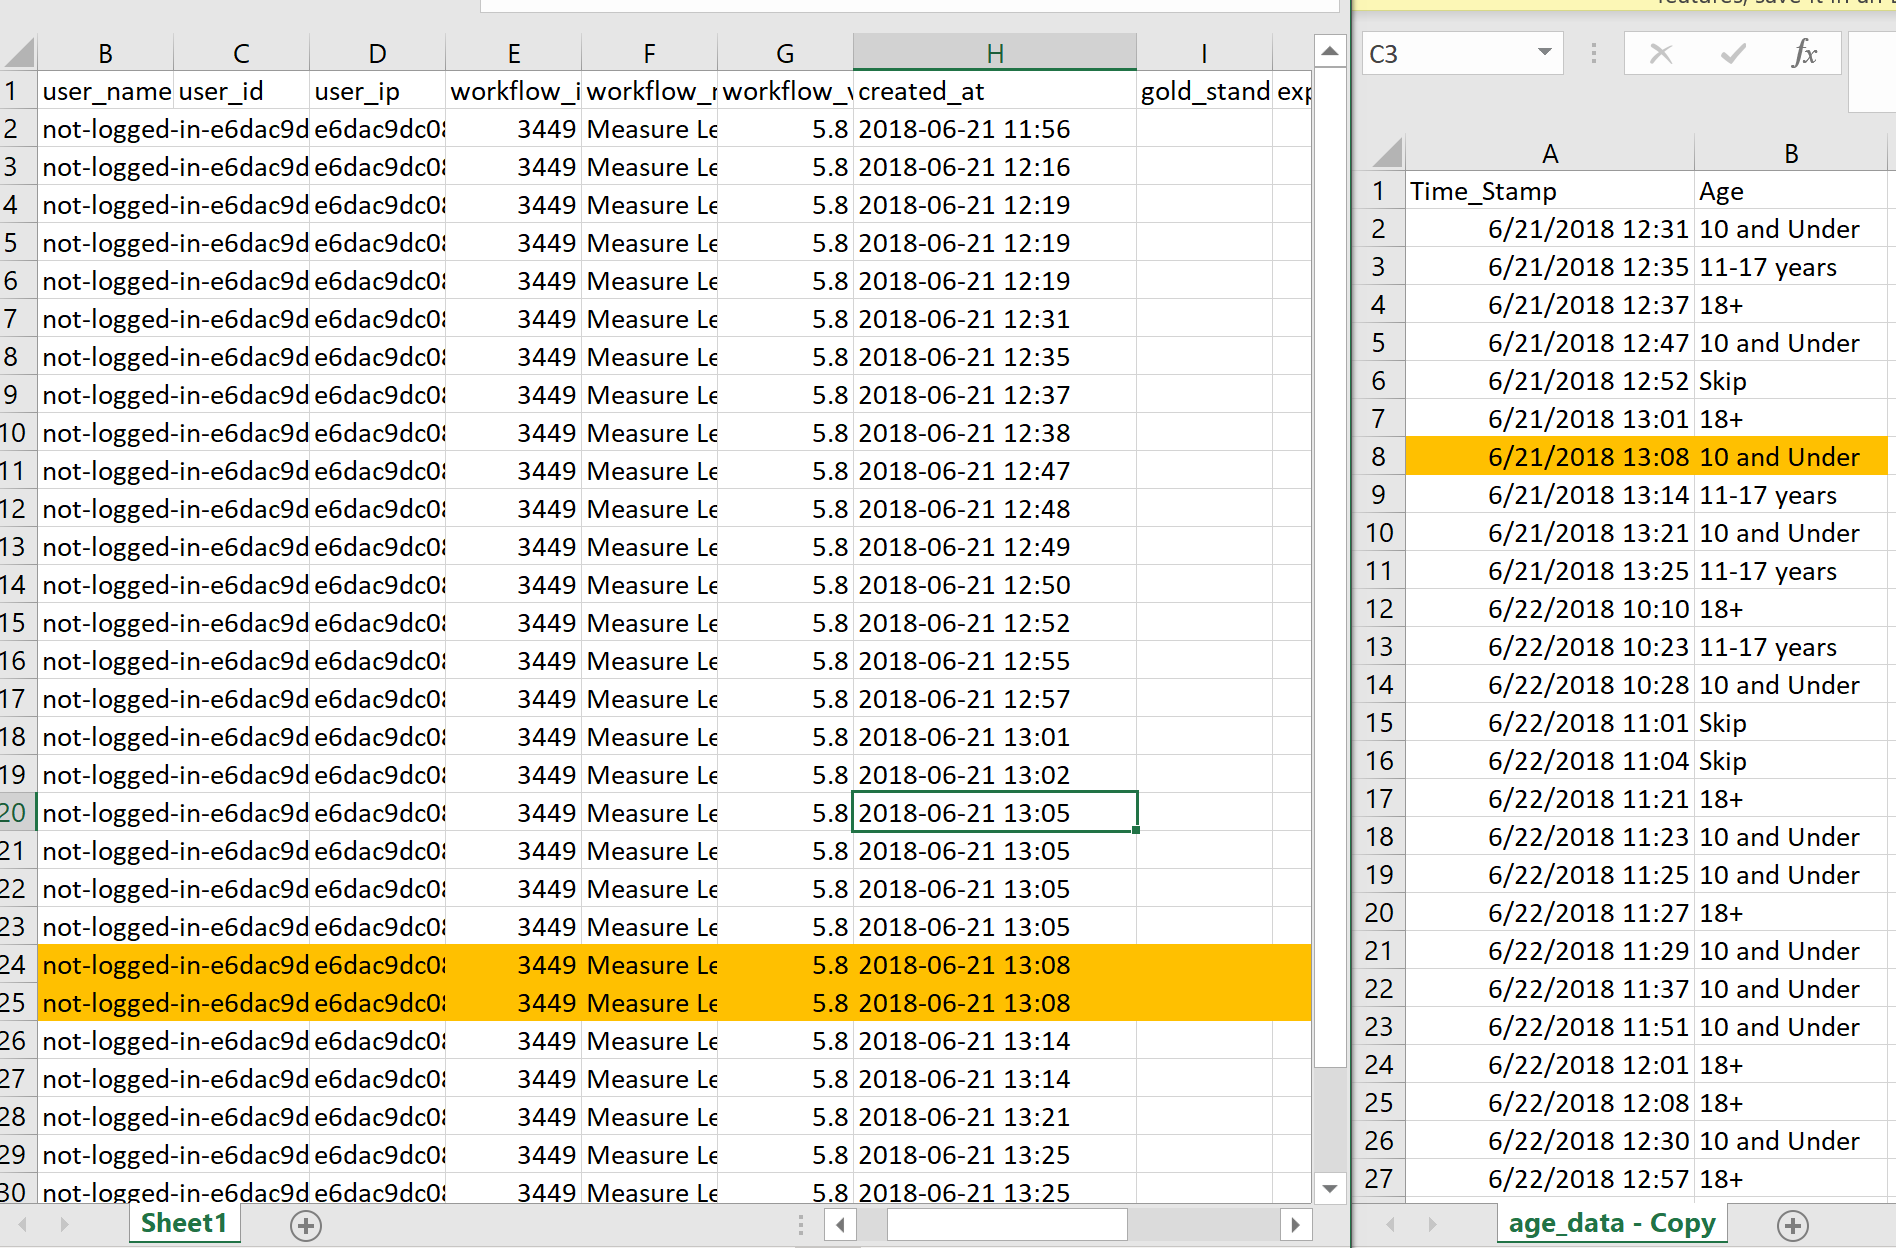
We can assume that since the timestamps are very close together, that this data is probably from the same user and thus can use the age demographic entry for both the highlighted measurement entries. To reflect this in our code, we simply did not increment the row counter for the age data whenever we ran into two rows in measurement data that corresponded with the current row in age data.
We ended the day with a meeting at Northeastern Illinois University where I talked with Francisco, a professor in computer science, as well as Beth, a graduate student. Beth will be working with using machine learning to classify ferns (which is part of my third project of the summer) and I’ll be shadowing her project to learn about machine learning, both theoretically and practically, as well as learn how to apply it for my own uses.
Happy hump day! We’re over halfway through!
-Al
Thursday June 27, 2019
Today started off with debugging! (Yay… my favorite) When we last left off, the cleaning script worked with a snippet of data from the kiosk measurements, but when we used the CSV with measurement data that corresponded with the date range from the age data sheet, we kept getting a JSON error. I personally had no idea what a JSON error, but after reading through a few Github threads and analyzing the problem, everything pointed to it being an issue with our data file. But this file was over 1000 lines long…luckily, using Excel’s CTRL + ‘down key’ we found a few blank rows. After removing them, the first issue of the day was solved and we were able to export the data for all of the measurements that matched with a timestamp on age data! Success!
But of course, we can’t ride on our successes for long. Currently, if there is an entry in measurement data whose timestamp does not correspond with an entry from age data, it’s ignored. But after talking with Matt we realized this was wrong. Here’s why:
When people come up to use the kiosk, they’re first asked what age group they are. That’s where the time stamp for age data comes from. Then they’re shown pictures of the microplants where they make the measurements. Maybe they just do measurements on one image, maybe they do it on ten. Recall that each time they change images, an entry in measurement data is made. Thus all these measurements are associated with that one age data time stamp. Then when the user is done, they hit ‘Quit’ which resets the kiosk, allowing the next person to repeat the entire process.
For now, we need to treat all the entries in measurement data that do not directly correspond to a timestamp in age data to correspond with the last occurring timestamp in age data. Although there will be cases where no one hit exit and an entry in measurement data will correspond with a timestamp that was perhaps a few hours ago, we need not worry about that yet. In the future, we will get to putting less weights on these entries, since they are less likely to actually be associated with the entry in age data. This change in the code is not difficult, but to do it most efficiently we decided not to change anything regarding the appending of the data frame, but changing how the algorithm loops through the data.
Thanks for reading!
-Al